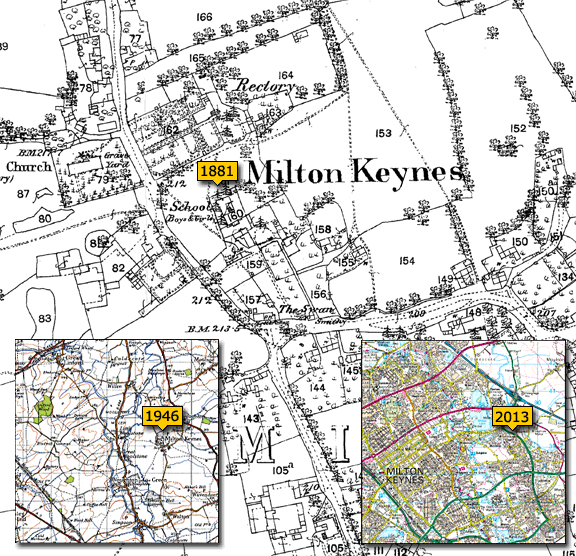
Surveyed 1914-1948, published 1945-1948
(available from http://www.cassinimaps.co.uk/shop/printedOS.asp)
The mid 1940s was a period of intense regeneration and renewal in Britain. The Second World War had been won, but at a vast financial and human cost. The physical damage and disruption, though less severe than in many other countries, was considerable; more insidious were the conflict’s legacies of social and geopolitical changes. Atlee’s postwar government promised a new society forged from the wreckage of the old, although the immediate reality was one of bomb sites, creaking infrastructure and continued food rationing. The country’s post-imperial decline was already a fact in 1945, even though this would not become clear to all until the Suez Crisis a decade later.

The conflict also had an impact on the Ordnance Survey. As in 1914, its original military role was reawakened with thousands of staff detailed to create accurate maps of Britain and Europe. Over 120 million sheets were printed for the D-Day landings alone, despite the fact that the Ordnance Survey’s Southampton headquarters had been largely destroyed in a bombing raid in 1940 and production had been forced to move to temporary quarters in Chessington.
The war had proved the importance of the railways in moving vast numbers of troops and evacuees, but it was to be their last great contribution to the nation’s transport needs. The network had survived the conflict without significant damage, but this proved to be a mixed blessing, for investment – badly needed after years of neglect – was thus not seen as a priority. One major change was the nationalisation of the ‘big four’ railway companies in 1947. A brief period of recovery followed, but from the early 1950s passenger numbers started a decline that was not reversed until the late 1970s. The car had taken over as the transport method of choice. Over 2.4 million vehicles were registered in Britain by the end of the 1940s as opposed to about a quarter of a million in 1921. Car travel increased social as well as personal mobility and also led to an
increasing demand for appropriate mapping.
The problem of surveying and recording Britain’s ever-changing landscape – one inhabited by over 50 million people by 1951 – had been exercising the minds of the government, the military and the Ordnance Survey ever since the completion of the Popular Edition in the late 1920s, although the cartographic ambitions of these parties did not always coincide. The Fifth Edition of the 1930s was the result of various experiments of projection, sheet lines and styling which ultimately proved unsuccessful and the project was abandoned in 1939 with only a small number of sheets having been produced.
Its replacement, devised in 1938, but delayed by the war, was the New Popular Edition, which first went on sale in 1945. Initial publication was completed in 1947, but sheets covering south-east England, including London, were republished with road and other revisions (including bomb damage in the capital) between 1947 and 1950. The New Popular Edition was a mixture of Fifth Edition-style material in southern England and ‘old’ Popular Edition material elsewhere, with subsequent revision. It was eventually superseded by the Seventh Series between 1952 and 1961.
The New Popular Edition was in many ways a departure from previous Ordnance Survey series. Although still produced at the one-inch scale, it included (as recommended by the Davidson Committee in 1938) a metric National Grid. It was also the first series to incorporate Scotland as well as England and Wales using a consistent numbering system (although the Scottish sheets were not published), and was the first to be produced in portrait rather than squared or landscape format, with sheets of 45km x 40km. It also used the Transverse Mercator projection, rather than the Cassini which had been used by the Ordnance Survey since the inception of the one-inch nearly 150 years before.
The New Popular Edition was not produced from any one revision designed for the creation of the series and so is something of a hybrid: cartographically a stepping stone between the iconic Popular Edition of the 1920s, and the Seventh Series of the 1950s and the metric-scale 1:50,000 maps that followed from it. They provide a record of the country in the immediate aftermath of the Second World War and on the threshold of great social, economic and environmental change. Many rural areas were almost unchanged compared to how they appeared a century or more before, while many urban centres were industrialised, overcrowded
and heavily bomb-damaged. Open countryside was still commonplace across the country as a whole, but was fast being eaten into by the suburban sprawl of large cities. The railway network remained intact, but Dr Beeching’s axe was only a decade or so away, as was the opening of Britain’s first motorway, the M1. The New Popular Edition captures all this ‘raw material’ which planners and developers in subsequent decades were to use, for better or for worse, to create the Britain that we know today.
The New Popular Edition captures the ever-changing landscape of Britain at a crucial time in its history. The inter-war years arguably saw the emergence of ‘modern’ Britain. The patterns of development and transport links these maps reveal are in many cases familiar to the contemporary eye. Much, however, was about to change, in particular the suburban encroachment into the countryside and the further expansion of the road network. The Popular Edition is a potent record of the Britain that was about to be traded for the motor car. By an irony, it also provided the British with their first motoring maps.


